We’ve compiled a list of the best 6 Data Visualization tutorials, courses, classes, online certificates and trainings for you. The teaching styles definitely differ. Make sure to watch a few trailers and Data Visualization course previews to find a good fit. We chose these Data Visualization courses based on various factors such as difficulty level, instructor, price (free vs paid), duration and the number of students enrolled. Take the first step to becoming an expert.
This post contains affiliate links. For more information, visit my disclosure page.
The Best Data Visualization Courses in 2021
- Introduction to Data Visualization: From Data to Design | Nicholas Felton
- Learning Data Visualization Online Class | LinkedIn Learning, formerly Lynda.com
- Learn Data Visualization in D3.js (D3 Library Intro Course)
- Learning Python for Data Analysis and Visualization
- Data Science A-Z™: Real-Life Data Science Exercises Included
Introduction to Data Visualization: From Data to Design | Nicholas Felton
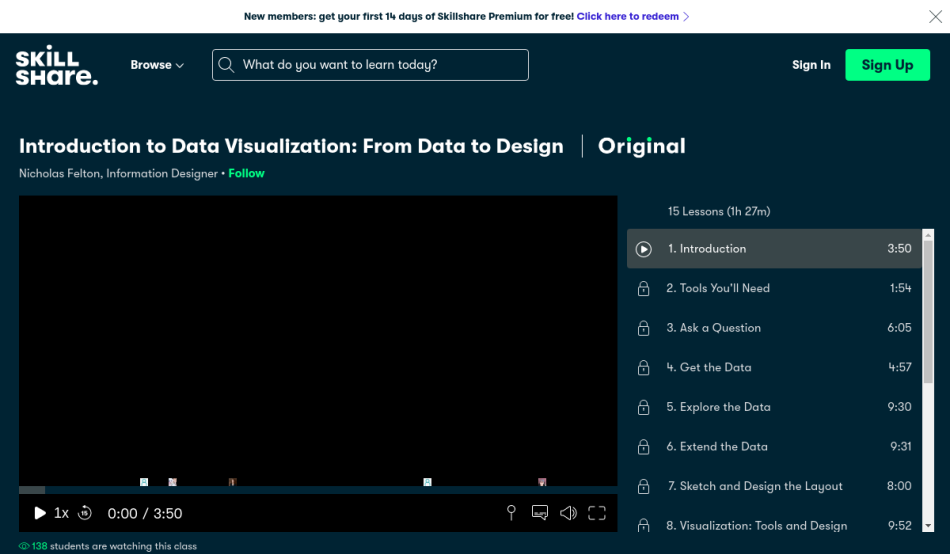
If you’re looking for an comprehensive introduction to Data Visualization, this is the right course for you. It will provide you with the specific tool set you’ll need in this platform. By the end of the class, you will be able to build a data set of your own.
The Introduction to Data Visualization: From Data to Design is taught by Nicholas Felton, an information designer, and is available on Skillshare. At the time of posting this article, there are more than 10,496 students signed up so far.
Skills you will learn
- Learn the basic concepts of Data Visualization
- Know the essential tools such as building a data set
- Practice transforming information into graphics
- Understand data visualization features like visualization of tools
- Master design, elements and approach, statistics, color, and topography
- Discover how data effectively works in storytelling
This course is best suited for students who want to learn the fundamental concepts of data visualization, as well as designers, visual thinkers, content strategists, and marketers, who want to gain knowledge in quickly understanding data.
Platform: Skillshare
Duration: N/A
Learning Data Visualization Online Class | LinkedIn Learning, formerly Lynda.com
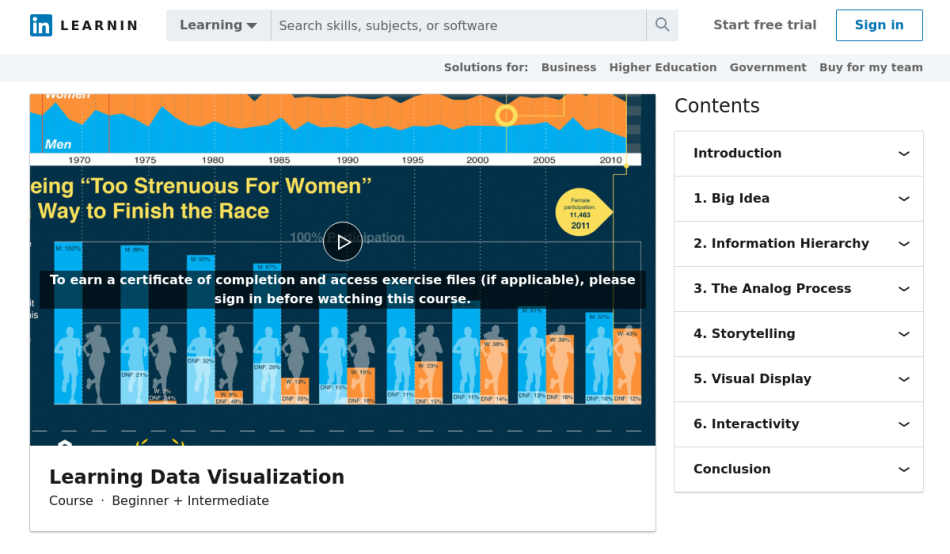
This online tutorial will teach you everything you need to know about Data Visualization. It will provide you with techniques on how to communicate complex ideas. Furthermore, it will guide you in how to transform information into artwork and storytelling.
The Learning Data Visualization Online Class is taught by Bill Shander, a public speaker and workshop leader focused on information design, data storytelling and visualization, and creativity. As of the moment, there are more than 38,835 students registered, who found this class on Linkedin Learning.
Skills you will learn
- Learn the basic fundamentals of Data visualization
- Understand essential tools like chart selection, and visual perception
- Discover enhanced skills in communicating data through design, legends, and scale
- Craft your own story from scratch
This course is specially designed for students who want to learn the fundamental concepts of Data Visualization.
Platform: LinkedIn
Duration: Almost 4 hours
Learn Data Visualization in D3.js (D3 Library Intro Course)
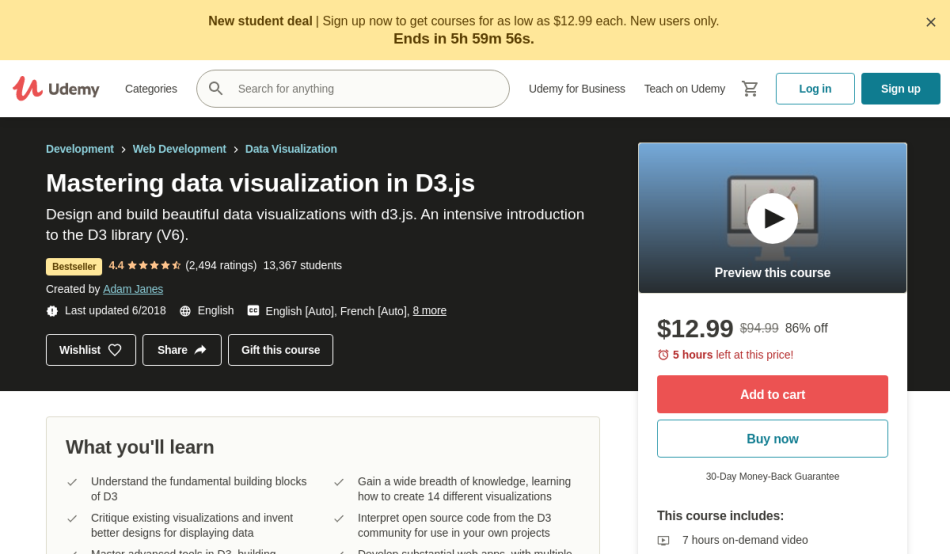
This Udemy course will help you explore the foundational topics in Data Visualization. It will teach you how to virtually build a visualization. At the end of the course, a certificate of completion is available for you to download.
The Learn Data Visualization in D3.js (D3 Library Intro Course) is taught by Adam Janes, a Data Visualization engineer, and is available on Udemy. Currently, there are over 13,461 students students enrolled for this class.
Skills you will learn
- Understand the fundamental concepts of Data Visualization
- Learn how to effectively make a design dynamic and interactive
- Know essential features in Data Visualization
- Master line charts, pie charts, donut charts, area charts, and stacked area charts
- Design and develop your own fully functioning web app
This course is specially designed for students who want learn about data visualization, as well as anyone who is interested in building complex interactive websites.
Platform: Udemy
Duration: Almost 7 hours
Learning Python for Data Analysis and Visualization
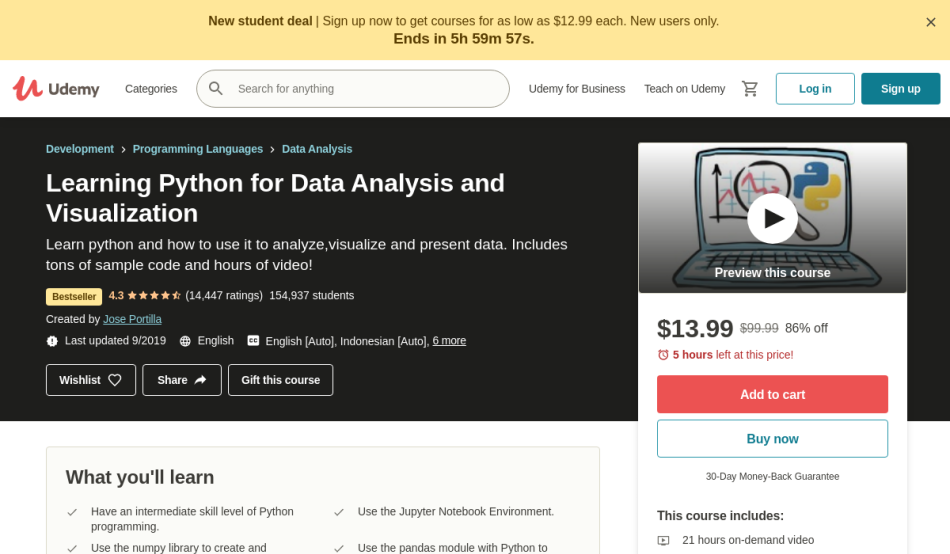
This course will teach you all about Data Visualization. It will guide you into analyzing, visualizing, and presenting data using the Python platform. Upon completion of the course, a certificate is available for you to download.
The Learning Python for Data Analysis and Visualization course is taught by Jose Portilla, the head of Data Science in Pierian Data Inc., and is available on Udemy. This is a very popular class, with more than 155,205 students already registered.
Skills you will learn
- Learn the basic dynamics of analyzing and visualizing data using the Python platform
- Know how to analyze data sets using pandas
- Create attractive data visualization using seaborn libraries and matplotlib
- Discover various python data formats and how they work
This course is specially designed for students who want to gain essential knowledge in data science and data visualization through Python.
Platform: Udemy
Duration: 21 hours
Data Science A-Z™: Real-Life Data Science Exercises Included
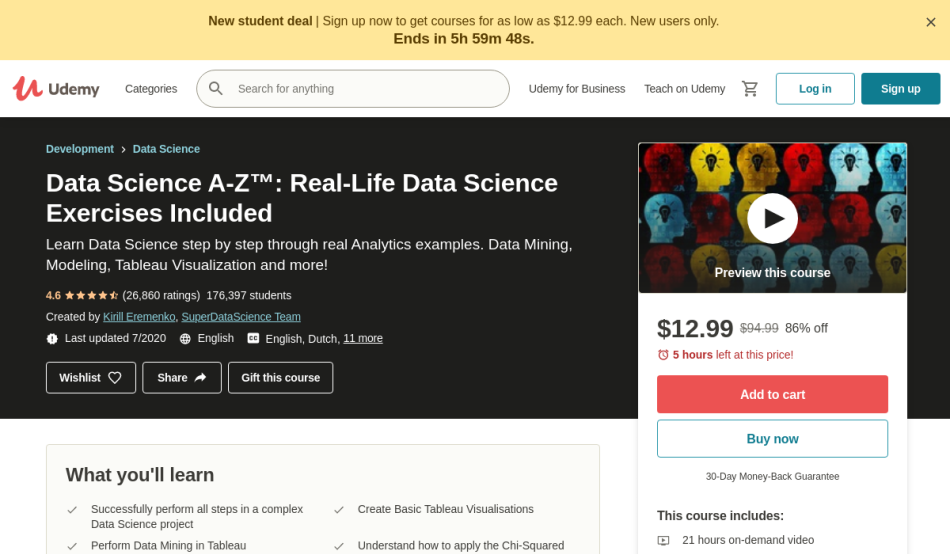
This tutorial will provide you with a comprehensive overview of Data Visualization. It will teach you everything about data science from scratch. At the end of the course, a certificate of completion is available for you to download.
The Data Science A-Z™: Real-Life Data Science Exercises Included course is taught by Kirill Eremenko, a data scientist, and is available on Udemy. The instructor is very popular, and the number of students keeps growing with more than 176,771 students already enrolled.
Skills you will learn
- Learn how to properly prepare and clean data
- Understand essential tools like Gretl, SQL, Tableau, and SSIS
- Know how to perform basic data visualization
- Discover how to effectively perform maintenance to prevent modern deterioration
This course is great for anyone who is interested in data science, as well as students aiming to further improve their skills in data mining, presentation, and preparation.
Platform: Udemy
Duration: Almost 21 hours
We hope you found the class you were looking for. Did you enjoy our favorite Data Visualization online programs, courses, classes with certification? What class did you choose? Let us know. Cheers to your success!